The Ultimate Guide To FTSE 100 Dividend Yield: How To Unlock Your Passive Income Stream From The FTSE 100
What Is The FTSE 100 Dividend Yield And How Does It Work?
To understand the FTSE 100 dividend yield, let’s start with a simple, everyday analogy that we can all relate to... buying a buy-to-let property. If you purchase a flat in London for £200,000 and rent it out for £10,000 a year, your annual rental yield is 5%. You calculate this by dividing the rent by the purchase price (£10,000 ÷ £200,000) and multiplying by 100. A stock's dividend yield works in exactly the same way. It measures how much "rent" (dividends) a company pays you relative to its "property price" (share price). The standard formula is straightforward...The Seesaw Relationship Between Share Prices And Yields
One of the most critical concepts you must grasp as a proactive dividend investor is that the dividend yield is not static. It is constantly on a seesaw with the company's share price. Because the current share price is the denominator (the bottom number) in our formula, the yield moves in the exact opposite direction of the price. When the share price of a company falls, and its dividend remains unchanged, the dividend yield automatically shoots up. For example, if our £1,000 stock drops in price to £500, but the company still pays its £50 dividend, the yield doubles to 10%! Conversely, when a company’s share price rises because the business is performing beautifully, the dividend yield compresses or goes down. This is exactly what we have witnessed in the wider UK market recently. As the FTSE 100 has put in a stellar run— breaking past the historic 10,000-point barrier for the first time and trading around 10,650 to 10,870 in 2026— the rising share prices have naturally led to a yield compression across the index. While your existing investments are worth much more, new buyers are entering at a lower average yield of around 2.95% to 3.03%. Understanding this relationship is your first step toward spotting great deals. A falling share price isn't always a disaster; if the company is fundamentally healthy, it can be a golden opportunity to lock in a much higher yield on your purchase, boosting your long-term passive income.The 2026 Landscape: Why The FTSE 100 Dividend Yield Is Reaching Historic Peaks
If you are looking to make your money work harder for you, there has rarely been a more exciting time to look at the UK Stock Market. Despite global economic shifts and local regulatory updates, the FTSE 100 dividend yield landscape in 2026 is showing spectacular strength. According to consolidated data from industry watchdogs like AJ Bell, FTSE 100 companies are forecast to pay out a staggering, record-breaking £88.8 billion in ordinary dividend payments to investors in 2026. This completely obliterates the previous all-time high of £85.2 billion set back in 2018, marking a triumphant return to form for UK corporations. But ordinary dividends are only one part of the story. Alongside these direct payouts, UK boardrooms have also declared a massive £36 billion in share buybacks for 2026. A share buyback is when a company uses its spare cash to purchase its own shares from the market, reducing the total number of shares in circulation. For you, the investor, this is fantastic news because it makes your remaining shares more valuable and concentrates future dividend payments. When you combine the £88.8 billion in ordinary dividends with the £36 billion in buybacks, the total cash return flowing back to FTSE 100 investors is projected to reach an eye-watering £124.8 billion in 2026. That represents roughly 4.7% of the entire index's £2.7 trillion valuation. To put that cash return into perspective, let's look at how it stack up against other ways to save or invest. While the Bank of England cut its base interest rate to 3.75% in April 2026, and benchmark 10-year government bonds (gilts) are trading at around 4.8%, the cash yields offered by top UK companies remain incredibly attractive—especially when you factor in the potential for your capital to grow over time. Unlike a fixed-income bond or a standard savings account where your cash is slowly eaten away by inflation, high-quality UK shares have the ability to increase both their profits and their dividend payouts year after year, protecting your purchasing power.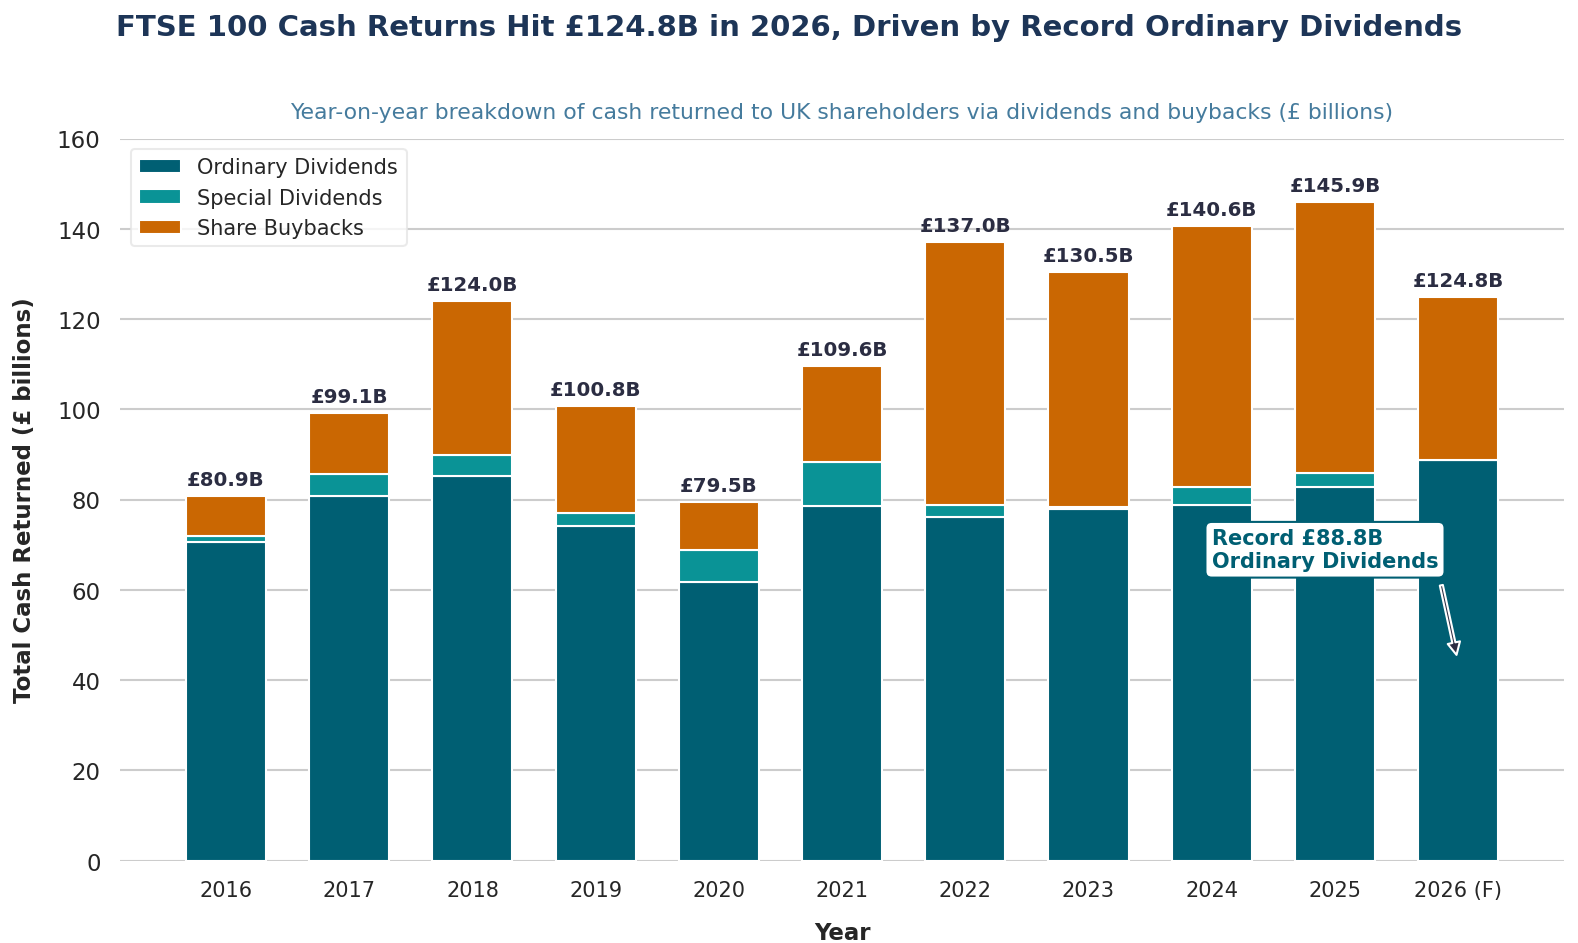
The Index Concentration: Where The Billions Are Flowing
Now, you might be wondering... who is actually paying out this massive mountain of cash? The vast majority of these payments are heavily concentrated in a select group of world-class businesses. In fact, just ten companies are expected to account for 52% of the total £88.8 billion dividend payout in 2026. The single largest dividend contributor in the entire index is the global banking giant HSBC Holdings, which is forecast to distribute a mind-boggling £10.7 billion to its shareholders this year. Following closely behind is the energy titan Shell, which is set to return £6.3 billion to its investors. This tells us that the UK market is anchored by mature, highly profitable global businesses that operate in sectors with high cash generation. If you own a broad FTSE 100 index tracking fund, more than half of the cash dropping into your account is being generated by these ten massive corporate engines. Understanding this index-level concentration is vital for your risk management, as it means the health of the overall index yield is closely tied to the performance of these major sectors.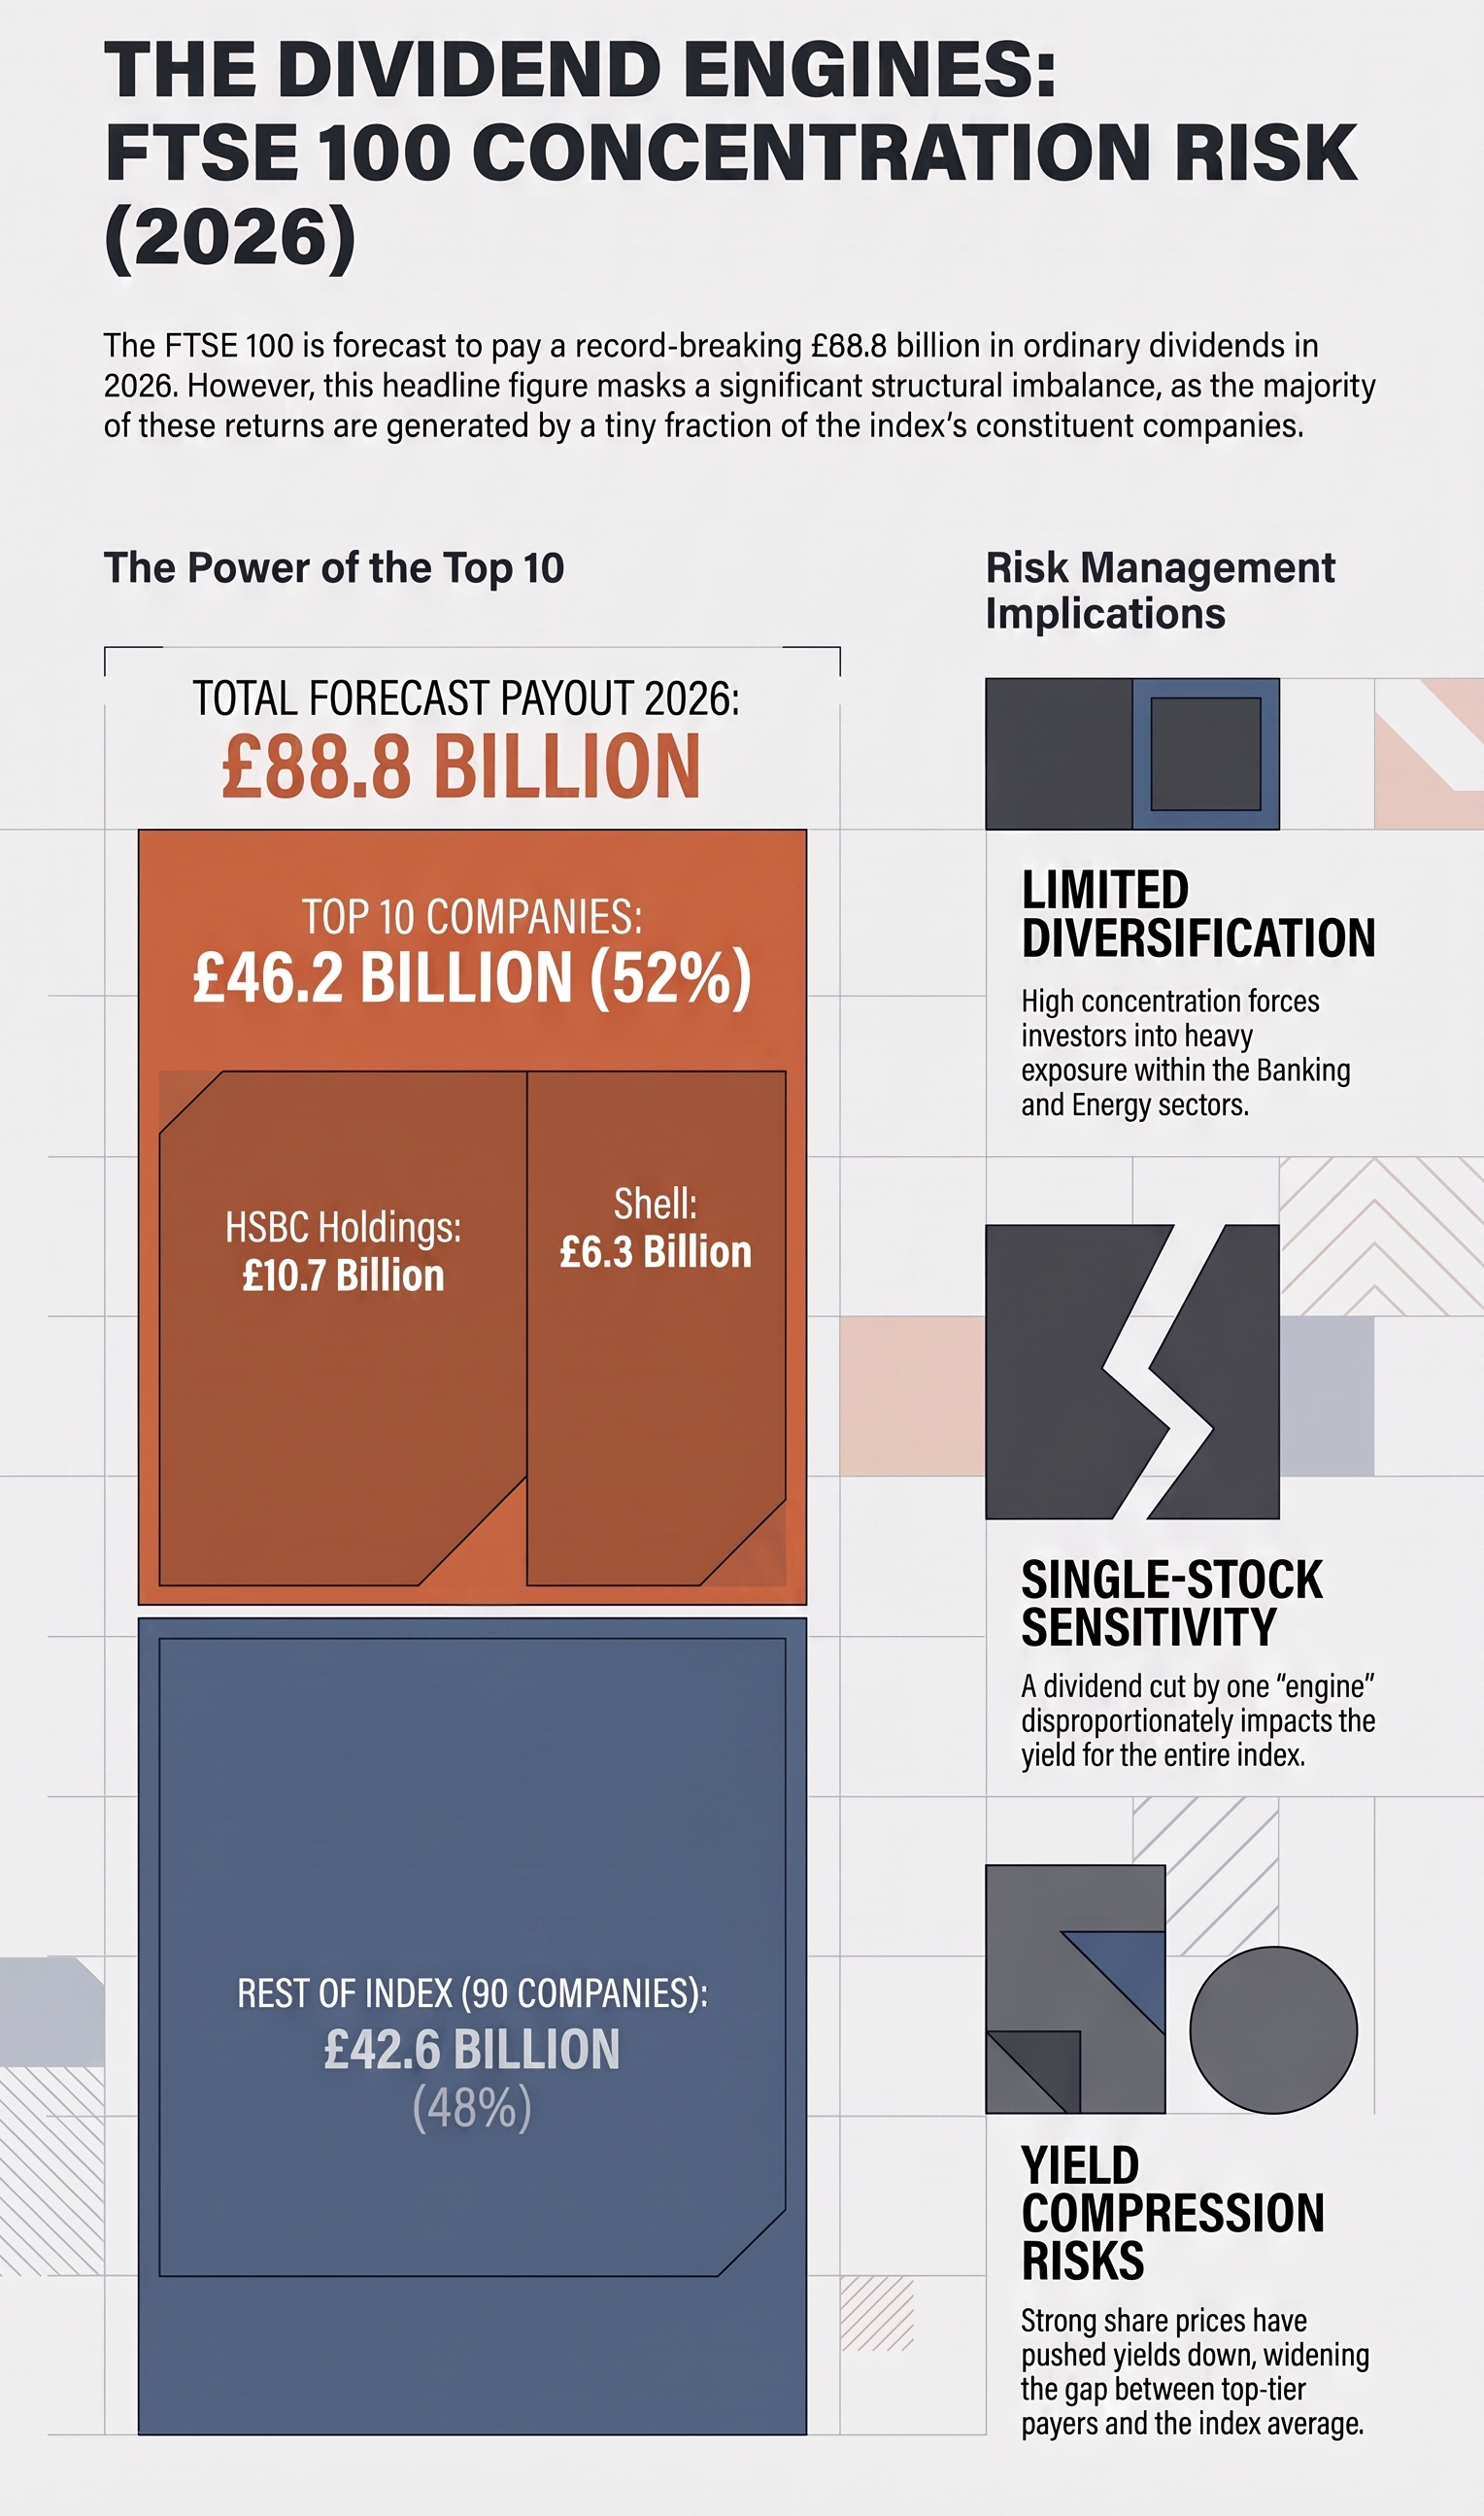
Spotting The Income Champions: High-Yield Sectors And Real-World Examples
If you want to build a highly successful income-focused portfolio, you cannot just buy any random collection of shares. You need to understand which parts of the market are structurally designed to pay high, reliable dividends. Within the UK Stock Market, different sectors behave in completely different ways. A high-growth technology company will usually reinvest every penny of its profits back into research and development rather than paying a dividend. On the other hand, mature, steady sectors like financial services (particularly the life insurance sector, utilities, and Real Estate Investment Trusts (REITs) have business models that naturally generate consistent, surplus cash that they can comfortably pass on to you. Let’s take a look at five real-world income champions that are currently sitting at the top of the FTSE 100 yield table in 2026, offering yields that are significantly higher than the index average of 3.03%.1. Legal & General (LGEN) — 7.59% Yield
Operating across life insurance, asset management, and retirement solutions, Legal & General is a financial services powerhouse. It has held the crown as the highest-yielding stock in the entire FTSE 100 by a meaningful margin for two consecutive quarters. L&G reported a core operating profit of £1.62 billion for its full year, up 6% on the previous period, and raised its full-year dividend by 2% to 21.79 pence (£0.21) per share. Even better for income investors, management is guiding for continued dividend per share growth of around 2% in 2026, backed by a massive £1.2 billion share buyback programme. When you invest in a company like L&G, you are backing a business with a remarkable 16-year track record of consecutive dividend growth. The key metric to watch here is their capital position—specifically their Solvency II coverage ratio, which currently stands at a robust 210%.2. Standard Life (SDLF) — 6.60% Yield
Standard Life is another legendary name in the UK's financial services and life insurance sector, providing pensions and retirement savings to millions of customers.Because pensions and life insurance are long-term, predictable businesses, Standard Life is able to plan its cash flows decades in advance and maintain a highly stable, growing dividend for over ten years. The current yield of 6.60% is highly attractive, and with a price-to-earnings (P/E) ratio of approximately 7.48, the market is pricing this stock at a very reasonable valuation. Furthermore, the Bank of England’s decision to cut interest rates to 3.75% in April 2026 has created a constructive, positive backdrop for their massive investment portfolios, helping to support long-term dividend sustainability.3. Londonmetric Property (LMP) — 6.58% Yield
Moving from financial services to real estate, Londonmetric Property is a specialist Real Estate Investment Trust (REIT) focused on highly resilient logistics, healthcare, convenience, and leisure real estate across the UK. Why are REITs such amazing vehicles for passive income? By law, UK REITs are exempt from corporation tax on their property rental business, but in exchange, they are structurally required to distribute at least 90% of their taxable rental profits directly to shareholders as dividends. Londonmetric’s portfolio is structured predominantly around "triple net leases," which means the tenants themselves are responsible for building maintenance, insurance, and property taxes. This leaves Londonmetric with incredibly clean, predictable, and hands-off rental income. With a ten-year track record of stable and growing payouts, and an impressive 17.6% dividend hike to 12.0 pence (£0.12) per share recently, this logistics specialist is an outstanding addition to any income-focused portfolio.4. Land Securities (LAND) — 6.27% Yield
Land Securities, or Landsec, is the UK's largest listed commercial property company and a pillar of the FTSE 100 REIT sector. Their massive portfolio spans high-quality offices in London, major retail destinations, and modern mixed-use urban developments. As interest rates begin to fall, property giants of this scale are attracting massive renewed interest from income hunters. Falling borrowing costs make it cheaper for Landsec to fund its developments, while the stable rental cash flows from its high-quality corporate tenants ensure that its 6.27% dividend remains highly dependable and defensive.5. Investec (INVP) — 6.06% Yield
A specialist banking, wealth, and asset management group operating internationally across the UK, South Africa, and beyond, Investec is a fresh entrant to the top five highest-yielding list. Investec's attractive yield of 6.06% is supported by booming private banking revenue and expanding margins in their wealth management divisions. While their South African exposure does introduce some currency and emerging market volatility, their diversified international business model provides an excellent, non-correlated income stream for investors who want to branch out from traditional UK-centric banks. By looking at these real-world examples, you can see how focusing on cash-generative sectors like life insurance and listed real estate allows you to build a highly robust, high-yielding portfolio that can outpace inflation and deliver serious long-term cash flow.S&P 500 vs FTSE 100: Understanding Price Performance vs. Total Return
If you have spent any time looking at the global stock markets, you have probably noticed a massive debate online. Many mainstream commentators point to the S&P 500 in the United States and highlight how its price chart has completely dominated the FTSE 100 in London over the last two decades. They are absolutely right on one front... on a pure price-level chart, the FTSE 100 can look like it is standing completely still, stuck trading around the same levels for years, while the S&P 500 has climbed to historic heights. But judging an income-focused market like the UK on its price chart alone is a massive, rookie blunder. It is exactly like judging a buy-to-let rental property solely by what its brickwork looks like, while completely ignoring the monthly rent payments dropping into your bank account. When we compare these two markets, we must look at total return— which measures share price growth PLUS all the dividends you receive and reinvest over time. Let’s look at the fascinating, 20-year data comparing these two giants... Over a twenty-year period to 2025/2026, the S&P 500 delivered a stellar annualised total return of 10.7% with dividends reinvested. The FTSE 100 delivered an annualised total return of 6.4% over a comparable period. While the S&P 500 won on pure growth, the composition of the two indices explains the entire gap. The S&P 500 is heavily concentrated in high-flying, low-dividend technology stocks (which make up about 35% of the index), whereas the FTSE 100 contains virtually no mega-cap tech exposure. Instead, the FTSE 100 is packed with mature financial services, energy, mining, utilities, and consumer goods companies that focus on returning cash to shareholders rather than hoarding it. This structural difference is why the FTSE 100 dividend yield typically yields around 2.95% to 3.4% historically, compared to a tiny 1.08% yield for the S&P 500. Now, here is the mind-blowing statistic that every income investor needs to write down... roughly half of the FTSE 100's entire 20-year total return came directly from dividends, not price changes! While the FTSE 100 index rose about 122% on price alone over 20 years, its total return with dividends reinvested skyrocketed to 244%.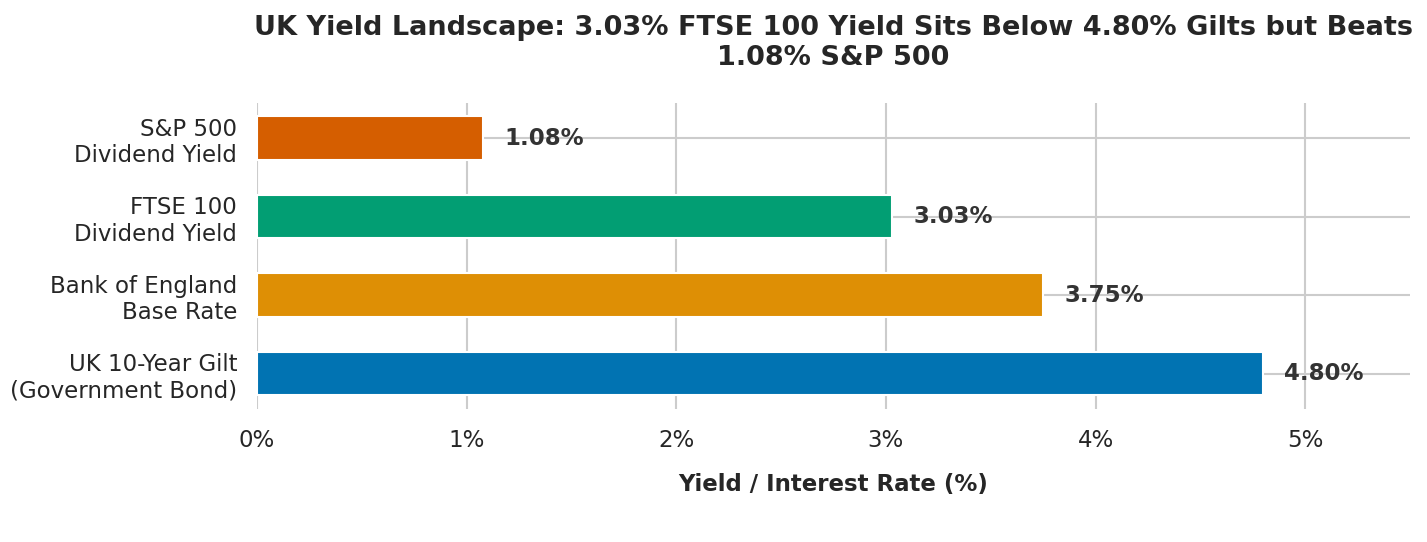
The Currency Catch And The 2025 Trend Reversal
For UK-based investors, there is also a hidden currency variable that has quietly boosted US returns over the last twenty years. Back in 2005, one British pound bought a massive $1.82. By 2025, that exchange rate had fallen to roughly $1.32—a decline of 27.5% in the value of sterling. Because US shares are priced in US dollars, this falling pound acted as a powerful tailwind, inflating the value of your American holdings when converted back into sterling. But currency moves can cut both ways, and if the pound strengthens in the future, that tailwind will instantly turn into a headwind. More importantly, long-term historical averages are not a guarantee of future performance. Stock Market cycles move in waves, and the tide is starting to turn. In 2025, the FTSE 100 put in its best performance since 2009—surging by 21% (and a massive 25.8% total return) and completely outperforming the S&P 500 for the first time in almost a decade! As global valuations on expensive US tech stocks stretched to a trailing P/E (Price-to-Earning) of 28, smart money began rotating out of overpriced growth shares and back into cheaper, dividend-paying UK companies trading at a forward P/E of just 13. This is a powerful reminder of why having a diversified portfolio that includes the high-yielding FTSE 100 is so crucial for protecting your capital and securing your financial future.The Dividend Investor's Toolbelt: How To Spot Safe, Sustainable Payouts
Now that you are excited about the potential of the UK market, let’s talk about how to protect your capital and make smart, informed investment decisions. As a dividend investor, your biggest threat is a "dividend cut"... when a company runs into financial issues and reduces or suspends its payouts, causing both your passive income and the share price to drop. To avoid this, you need to use three powerful tools in your analytical toolbelt.1. Dividend Cover (The Safety Cushion)
The single most important metric for checking dividend sustainability is called dividend cover (or earnings cover). This number tells you how many times a company's annual net profits can pay for its dividend. The formula is...2. Understanding The Critical Dividend Dates
If you want to receive your dividend check, you must understand the rules of the calendar. There is a very specific sequence of dates that determines who gets paid.- Declaration Date: The day the company's board of directors announces the upcoming dividend amount, the ex-dividend date, and the payment date.
- Ex-Dividend Date: This is the single most important date for you as a buyer. To receive the upcoming dividend, you must purchase the shares before this date. If you buy shares on or after the ex-dividend date, the dividend will go to the previous owner, not you. On this morning, the share price will typically drop by the exact amount of the dividend to reflect the cash leaving the company’s balance sheet.
- Record Date: Typically one business day after the ex-dividend date, this is when the company closes its registry and identifies all the qualified shareholders who are officially on the books to receive the cash.
- Payment Date: The golden day! This is when the hard cash is officially distributed and lands directly into your brokerage or ISA account. This usually happens anywhere from two to six weeks after the record date.
3. Avoiding The Siren Song of "Value Traps"
It is incredibly tempting for beginners to log onto a stock screener, sort the FTSE 100 by yield, and buy the company offering the absolute highest percentage. This is a classic blunder known as chasing a "value trap". Remember, since yield moves inversely to share price, an exceptionally high yield (say, 12% or 15%) is often not a sign of corporate generosity. Instead, it is usually a warning sign that the market expects a major dividend cut. The share price has dropped because the business is in structural decline or facing severe financial issues, temporarily inflating the historical yield figure. Always look for a sensible balance between a strong, sustainable yield and a company with a growing business, healthy cash flows, and robust dividend cover. A highly reliable 4% yield that grows by 5% every year is infinitely better than a shaky 10% yield that gets halved next month.The Wealth Multiplier: Reinvesting And Compounding Dividends
Now that you know how to find safe, high-yielding companies, let's talk about the ultimate secret weapon of the dividend investor... compounding dividends. Einstein famously called compound interest the eighth wonder of the world. In the Stock Market, compounding is the process of using your cash payouts to purchase more shares of the companies you own, which in turn pay you even more dividends, allowing you to buy even more shares. It is a beautiful, snowballing cycle of wealth creation. Let's look at a real-world example of how this plays out over the long term. According to historical data from the VT Munro UK Equity Income Fund— a highly respected UK mutual fund that replicates the Elston UK Equity Income Index by investing in the country's largest dividend-paying companies— there is a massive difference between investors who take their dividends as cash versus those who automatically reinvest them. If you invested in the fund’s "Income" share class (where dividends are paid out directly to your bank account as cash), you would have enjoyed a steady stream of monthly passive income. In the 12 months leading to March 2026, the fund paid out a total distribution of 4.5434 pence (£0.04) per unit, representing an attractive 3.81% yield on the share price at month-end. However, if you had invested in the fund's "Accumulation" share class— where every single penny of dividend income is automatically reinvested to buy more units in the fund— your wealth would have exploded. Over the 10-year period to March 2026, the Accumulation share class delivered a spectacular cumulative total return of 140.08%, compared to the wider UK Equity Income sector average of just 86.45%! Since the fund's inception in September 2007, the Accumulation shares have climbed to a price of 263.07 pence (£2.63), delivering a total return of 163.07%. That is the raw, undeniable power of compounding. By simply turning on "automatic dividend reinvestment" inside your brokerage account, you are transforming your portfolio from a simple income generator into an unstoppable, compounding wealth machine.How to Get Started: Building Your FTSE 100 Income Portfolio
If you are ready to take action and start earning passive income from the FTSE 100 dividend yield, you have two main routes to choose from.Route A: The Direct Stock-Picking Approach
In this route, you open a brokerage account and purchase individual shares in high-yielding FTSE 100 companies yourself, such as Legal & General, HSBC, Shell, or Londonmetric Property. This approach gives you complete control over your portfolio. You can design your own bespoke passive income stream, select exactly which sectors you want to back, and avoid paying any ongoing management fees to fund managers. However, picking individual stocks requires time, research, and discipline. It also exposes you to individual company risk— if one of your chosen businesses goes through an unexpected setback, your income could take a hit. To manage this risk, you should aim to hold at least 20 to 30 different companies across various sectors, ensuring you are never overly exposed to any single industry.Route B: The Hands-Off Index Tracking Approach
If you don't have the time or desire to research individual companies, the easiest and most effective way to start is by purchasing a low-cost exchange-traded fund (ETF) or index tracker that automatically buys all 100 companies for you. Popular, highly liquid options traded on the London Stock Exchange include...- iShares Core FTSE 100 UCITS ETF (ISF): One of the largest and cheapest trackers in the UK, which automatically distributes your share of the index's dividend income directly to your account.
- Vanguard FTSE 100 UCITS ETF (VUKE): A fan favourite among retail investors, offering highly efficient tracking of the UK’s top 100 companies at a rock-bottom ongoing fee.
- Amundi Core FTSE 100 Swap UCITS ETF (L100): An alternative structure that tracks the index's performance with extreme precision.
Protecting Your Wealth: The Power of ISA And SIPP Tax Shelters
No matter which route you choose, there is one final, golden rule that you must follow... always shelter your investments from the taxman. In the UK, the government provides two incredibly generous tax-efficient wrappers that every dividend investor should maximise... 1. Stocks & Shares ISA (Individual Savings Account): You can invest up to £20,000 every single tax year into an ISA. The best part? Any capital gains are 100% tax-free, and every single penny of dividend income you receive is completely sheltered from UK income tax forever. It is the single most powerful tool for building a tax-free passive income stream. 2. SIPP (Self-Invested Personal Pension): A SIPP is a personal pension that allows you to save for retirement with massive government tax relief. When you contribute money to a SIPP, the government automatically tops up your account by refunding the income tax you paid on those earnings. Like an ISA, all dividend income within a SIPP grows completely tax-free, making it a spectacular way to compound your retirement wealth. By utilizing these tax shelters and focusing on the cash-generating power of the FTSE 100 dividend yield, you can take control of your financial destiny, protect your hard-earned money, and build a reliable, growing passive income stream that will support you and your family for decades to come. The Stock Market is waiting—start your dividend investing journey today!Frequently Asked Questions About The FTSE 100 Dividend Yield
What is a good FTSE 100 dividend yield for individual stocks?
There is no single definition of a "good" yield, as it depends heavily on your personal investment goals and risk tolerance. The average historical dividend yield of the FTSE 100 typically ranges between 2.0% and 4.0%. Therefore, any stock offering a stable, well-covered yield within or slightly above this range (e.g., 4% to 6%) can be considered highly attractive. Be cautious of exceptionally high yields (e.g., above 8%), as they can sometimes signal that the market expects a dividend cut.
Can companies cut or suspend their dividend payments?
Yes, dividends are never guaranteed. A company’s board of directors can choose to cut, suspend, or completely scrap its dividend payments at any time if the business faces financial issues, economic downturns, or changes in regulatory requirements. This is why assessing a company's dividend cover and financial strength is so critical before investing.
How often do FTSE 100 companies distribute dividends?
Most FTSE 100 companies distribute dividends twice a year, consisting of a smaller interim dividend (usually announced with half-year results) and a larger final dividend (announced with full-year results). However, some companies choose to distribute their dividends quarterly, while others may pay special dividends on an ad-hoc basis when they have surplus cash.
What is the difference between an ex-dividend date and a payment date?
The ex-dividend date is the cut-off date that determines your eligibility to receive the upcoming dividend; you must purchase the shares before this date to get paid. If you buy on or after this date, the dividend goes to the seller. The payment date is the actual day when the cash is distributed and deposited directly into your brokerage or ISA account, which typically occurs several weeks after the record date.
Why does the S&P 500 have a lower dividend yield than the FTSE 100?
The difference is structural and comes down to index composition. The S&P 500 is heavily weighted toward high-growth technology companies (about 35% of the index), which prefer to reinvest their profits into expansion rather than pay dividends. Conversely, the FTSE 100 is dominated by mature, cash-generative businesses in financials, energy, utilities, and consumer goods that prioritise returning cash directly to shareholders.
How does the average FTSE 100 dividend yield compare to the FTSE 250?
The FTSE 100 typically offers a higher average dividend yield than the FTSE 250. This is because the FTSE 100 contains larger, more mature, and internationally-focused companies with stable cash flows. In contrast, the FTSE 250 is composed of mid-sized, domestic companies that are more growth-oriented and choose to reinvest a larger portion of their profits into business expansion.
Is my dividend income taxable in the United Kingdom?
In the UK, dividend income is taxable if it exceeds your annual tax-free dividend allowance. The rate of tax you pay depends on your personal income tax band. However, you can completely legally shelter your dividends from all UK taxes by holding your dividend-paying shares or index trackers inside a Stocks & Shares ISA or a Self-Invested Personal Pension (SIPP).
What is dividend cover and why does it matter?
Dividend cover (or earnings cover) measures how many times a company's net profits can pay for its dividend. A dividend cover of 2.0x or higher is considered healthy and comfortable because it shows the company earns twice as much as it pays out, providing a solid safety cushion in case profits decline. A cover below 1.0x is a major red flag, indicating the dividend is unsustainable and highly vulnerable to being cut.
How can I reinvest my dividends automatically?
Most modern stockbrokers offer an automatic Dividend Reinvestment Plan (DRIP), which takes your cash dividends and immediately uses them to buy more fractional or full shares of the same company, completely hands-off. Alternatively, if you invest in mutual funds, you can purchase the "Accumulation" (Acc) share class rather than the "Income" (Inc) class, which automatically reinvests all dividend income within the fund to grow your capital.
What are the primary risks of investing in high-yield dividend stocks?
The main risks include dividend sustainability (the threat of a payout cut), value traps (buying a declining business with a temporarily inflated yield), capital loss (where share price declines exceed your dividend income), and sector concentration (having too much exposure to a single high-yielding industry like life insurance or real estate). Diversification is key to managing these risks.
| 💡 Key Takeaways |
|---|
| Mastering the FTSE 100 dividend yield is the single most powerful way for UK investors to unlock reliable, compounding UK passive income without needing massive active management. |
| A stock's dividend yield measures annual distributions as a percentage of share price, creating a direct, inverse relationship where a falling price inflates the yield and a rising price compresses it. |
| In 2026, FTSE 100 companies are forecast to pay a record-shattering ordinary dividend payments total of £88.8 billion, demonstrating the immense cash-generating strength of the UK's corporate stalwarts. |
| When you combine ordinary dividends with £36 billion in declared share buybacks, the total cash return to investors reaches £124.8 billion, delivering a highly attractive yield that handily beats cash interest rates. |
| High index concentration means that just ten massive companies—led by HSBC Holdings and Shell—account for over 52% of all ordinary dividend distributions in the index. |
| Top-yielding sectors like the life insurance sector, Real Estate Investment Trusts (REITs), utilities, and banking consistently offer yields well above the 3.03% index-level average. |
| Over the long term, compounding dividends is the true driver of wealth, accounting for roughly half of the FTSE 100's entire 20-year total return compared to price growth alone. |
| Always check a company’s dividend cover before investing; the FTSE 100’s robust aggregate cover of 2.26x for 2026 shows that its historic dividend payouts are highly secure. |
| Look out for the critical ex-dividend date when purchasing shares, as missing this date by even a single day means you will lose eligibility for the upcoming payment. |
| To keep your passive income completely safe from the taxman, always shelter your stock-picking or low-cost index tracking portfolios within a tax-free Stocks & Shares ISA or a tax-efficient SIPP. |