What Is The Best Dividend
ETF For Total Return?
(Why Headline Yield Is A Trap)
When I first stepped into the world of ETF (Exchange Traded Fund) dividend investing, I made the classic rookie blunder...
... I sorted every Exchange Traded Fund on my platform by dividend yield and bought the ones sitting at the absolute top of the list. I saw eye-watering numbers like 7%, 8% and 11% annual cash payouts and thought I had unlocked a secret shortcut to passive income wealth. It felt like finding a rare fruit tree in a public park that dropped golden apples every single quarter without requiring any maintenance or care.It didn't take long for reality to set in. While the quarterly dividend payouts arrived on schedule, the actual market value of my investment capital kept shrinking month after month.
The share price dropped significantly faster than the cash dividends came in. By focusing purely on headline dividend yield, I had unknowingly walked straight into a classic dividend yield trap, watching my hard-earned capital erode while celebrating tiny cash payouts that barely covered my capital depreciation.If you are looking to make money from the Stock Market and build genuine, lasting wealth through dividend investing, you need a far smarter, more disciplined approach.
In this comprehensive guide, I will show you why chasing headline yield is a treacherous game, how to evaluate total return, and how to select the best dividend ETF to achieve your financial goals without risking capital erosion.The short answer: The best dividend ETF for long-term investors is not the fund with the highest current yield, but the one that combines consistent dividend growth with underlying capital appreciation to deliver superior total return.
What Is A Dividend ETF And How Does It Work?
Before we dive into comparing fund strategies, let's establish what an Exchange Traded Fund actually is in simple, everyday terms.
Imagine you want to buy fruit, but instead of buying a single apple tree from one farm, you buy a small share in a basket containing hundreds of orchards across the entire country. If one orchard endures a lean season, experiences a pest outbreak, or faces a crop shortfall, the remaining orchards keep producing fruit for you without interruption. That is precisely how a dividend ETF works. An Exchange Traded Fund is a collective basket of individual company shares pooled together into a single tradeable security that trades on a major stock exchange just like a standard share. When the individual companies inside that basket generate profits and pay out cash distributions to their shareholders, the fund manager collects all those payments and distributes them directly to you, usually on a quarterly or semi-annual basis.By investing in the best dividend ETF, you instantly achieve broad diversification across dozens or hundreds of dividend-paying businesses.
This eliminates single-stock risk... meaning you never have to worry about a sudden dividend cut or profit warning at one company destroying your entire portfolio income stream.Why Is Total Return More Important Than Dividend Yield?
The single most important concept you must master as an income investor is the distinction between dividend yield and total return.
Understanding this distinction will save you thousands of pounds over your investing lifetime and protect you from deep portfolio drawdowns.Dividend yield is simply the annual cash payout expressed as a percentage of the current share price. For instance, if an ETF costs £100 per share and pays £4.50 in cash dividends over the year, its dividend yield is 4.5%.
Total return, on the other hand, measures the actual overall money you make from your investment. It combines two vital components:
- Capital Appreciation: How much the share price of the fund increases over time.
- Dividend Payouts: The actual cash income distributed to you (and reinvested into extra shares).
To see why total return is the ultimate metric for building wealth, consider a simple real-world analogy...
...imagine you buy a rental house for £200,000 that pays you £12,000 a year in rent, a seemingly fantastic 6% yield. However, the neighbourhood is declining rapidly, structural issues emerge, and five years later, the house is only worth £140,000 on the open market. Even though you collected £60,000 in rental payments, your underlying asset depreciated by £60,000 in market value. Your net gain is zero!Now consider a second house bought for £200,000 that pays only £5,000 a year in rent (a modest 2.5% yield).
Over those same five years, the neighborhood thrives, infrastructure improves, and the home appreciates to £280,000. You collected £25,000 in rental income and gained £80,000 in property capital appreciation, producing a total return of £105,000.The exact same principle applies when searching for the best dividend ETF.
A fund offering a modest 1.5% or 2% dividend yield backed by strong corporate earnings growth and rising share prices will almost always outperform a high-yielding fund whose underlying asset value is stagnant or deteriorating.The Math of Capital Erosion: A 10-Year Case Study
Let's look at a realistic comparison between two £10,000 investments over a 10-year period to illustrate how headline yield can blindside you:
| Strategy Metric | Fund A: The High-Yield Trap | Fund B: The Quality Dividend Growth Fund |
|---|---|---|
| Initial Investment | £10,000 | £10,000 |
| Initial Dividend Yield | 7.5% per year | 2.0% per year |
| Annual Capital Growth Rate | -2.5% per year (Capital Erosion) | +8.5% per year (Earnings Growth) |
| Annual Dividend Growth Rate | 0.0% (Flat payouts) | +7.0% per year (Rising payouts) |
| Portfolio Value at Year 10 | £7,763 (Capital down 22.3%) | £22,610 (Capital up 126.1%) |
| Total Cumulative Dividends Received | £6,540 | £3,410 |
| Final Total Wealth (Capital + Cash) | £14,283 | £26,020 |
Notice what happened... Fund A gave you much bigger dividend checks early on, but its falling share price wiped out your core wealth.
Fund B started with smaller payouts, but its dividend growth and share price appreciation allowed it to generate almost double the total wealth of Fund A over a decade. That is the power of total return!How Do You Spot A Dividend Yield Trap Before Investing?
A yield trap occurs when an investment displays an artificially high dividend yield because its share price has fallen due to fundamental business issues.
Because dividend yield is calculated by dividing the annual dividend payout by the current share price, a plummeting share price automatically pushes the yield percentage higher, even if the company is in severe financial distress.When you evaluate funds on your trading platform to find the best dividend ETF, keep an eye out for these four classic warning signs of a yield trap:
- Unusually High Headline Yield: If an equity ETF advertises a dividend yield of 7%, 8%, or higher while the broader global market average sits around 2% to 3%, alarm bells should ring. Ask yourself why institutional investors are discounting those assets.
- Stagnant or Declining Historical Earnings: Businesses that refuse to innovate or adapt to changing consumer habits often pay high distributions to keep income shareholders from selling, even as their revenues shrink.
- High Concentration in Legacy Sectors: Funds heavily weighted toward declining industries (such as high-debt legacy telecommunications, commercial real estate, or fossil-fuel utilities) frequently experience capital erosion.
- Dismal 5-Year and 10-Year Capital Appreciation: Always examine the long-term price performance chart. If the fund's price returns are not positive over 5 or 10 years, those dividend checks are simply returning your own devalued capital back to you.
What Is The Best Dividend ETF Strategy: Aristocrats vs Quality Growth?
When building an income-focused portfolio, investors typically choose between two main indexing philosophies... Dividend Aristocrats and Quality Dividend Growth.
Dividend Aristocrats are companies that have successfully increased their dividend payouts every single year for a specified minimum consecutive period, typically 10+ years in the UK and globally and 20+ years in the US.
To survive multiple downturns and inflation spikes while raising cash payouts every single year, a company must possess an exceptionally durable competitive moat, stable cash flows, and disciplined corporate management.Quality Dividend Growth ETFs go a step further by evaluating fundamental financial health indicators.
Instead of relying solely on dividend history, quality-focused index methodologies screen companies using metrics such as Return on Equity (ROE), low debt-to-equity ratios, and steady cash-flow growth. This enables the fund to hold high-growth market leaders that pay moderate initial yields but expand their payouts rapidly alongside expanding corporate profits.Both strategies offer massive advantages over unsophisticated high-yield funds because they act as a natural inflation shield.
As consumer prices rise, high-quality dividend growers increase their payouts to keep pace, preserving your purchasing power over time.Which Best Dividend ETF Should You Choose?
For UK and European investors UCITS-compliant Exchange Traded Funds listed on the London Stock Exchange (LSE) provide optimal access to international dividend markets.
Let's compare three of the most popular global and US dividend ETFs, each taking a distinct approach to balancing yield, quality, and total return.1. Fidelity US Quality Income UCITS ETF (FUSD)
If your primary goal is maximizing long-term total return through quality-screened US companies, FUSD is a top-tier contender for the title of best dividend ETF.
| Metric | Details |
|---|---|
| Ticker Symbol | FUSD (traded in USD) / FUSP (traded in £) |
| Ongoing Charge (TER) | 0.25% per year |
| Dividend Yield | ~1.38% |
| 5-Year Annualized Return (£) | 11.95% |
| 3-Year Annualized Return (£) | 15.04% |
| Replication Method | Physical Full |
| Fund Size | ~£1.55 Billion |
| Top Holdings |
|
The Strategy: FUSD tracks the Fidelity US Quality Income Index, screening large and mid-cap US stocks for high Return on Equity (ROE), strong earnings growth, and strong cash generation.
Because its methodology prioritizes financial quality rather than chasing high yields, FUSD includes top-tier technology giants like NVIDIA, Apple, Microsoft, Alphabet, Broadcom, and Meta alongside cash-generative financial and healthcare leaders. Its technology exposure sits at a healthy 37.48%.The Verdict: While its 1.38% starting dividend yield might appear modest to pure income hunters, FUSD has delivered an outstanding 11.95% 5-year annualized total return.
It is an ideal anchor holding for wealth accumulators who want growing cash distributions without giving up exposure to US technology innovation and compounding capital growth.2. SPDR S&P US Dividend Aristocrats UCITS ETF (USDV)
For investors seeking proven defensive resilience and a pure track record of dividend reliability, USDV offers a classic US Dividend Aristocrats exposure.
| Metric | Details |
|---|---|
| Ticker Symbol | USDV |
| Ongoing Charge (TER) | 0.35% per year |
| Dividend Yield | ~1.99% (Factor yield ~2.87%) |
| 5-Year Annualized Return (£) | 7.24% |
| 10-Year Annualized Return (£) | 8.53% |
| Replication Method | Physical Full |
| Fund Size | ~£2.84 Billion |
| Top Holdings |
|
The Strategy: USDV tracks the S&P High Yield Dividend Aristocrats Index, selecting US companies that have systematically increased their dividends for at least 20 consecutive years.
Its holdings are heavily weighted toward defensive consumer staples (15.78%), industrial compounders (17.01%), utilities (12.54%), financial services (11.88%), and healthcare providers (8.57%). Technology accounts for just 10.34% of the fund.The Verdict: USDV provides a remarkably smooth, low-volatility investment journey with a 1.99% starting yield.
While it lacks the mega-cap tech firepower of FUSD, its 8.53% 10-year annualized return highlights its ability to compound capital steadily across downturns and bear markets.3. SPDR S&P Global Dividend UCITS ETF (GBDV)
If you want broad international exposure and a higher current payout, GBDV captures global Dividend Aristocrats across multiple continents.
| Metric | Details |
|---|---|
| Ticker Symbol | GBDV |
| Ongoing Charge (TER) | 0.45% per year |
| Dividend Yield | ~3.84% (Factor yield ~5.07%) |
| 10-Year Annualized Return (£) | 6.47% |
| 5-Year Annualized Return (£) | 7.94% |
| 3-Year Annualized Return (£) | 12.90% |
| Replication Method | Physical Full |
| Fund Size | ~£1.30 Billion |
| Geographic Breakdown | United States (53.36%), Greater Europe (23.40%), Canada (9.67%), United Kingdom (7.65%), Asia-Pacific (12.71%) |
| Top Holdings |
|
The Strategy: GBDV tracks the S&P Global Dividend Aristocrats Index, selecting the highest-yielding international companies that have maintained or increased their cash payouts for at least 10 consecutive years.
It offers true global diversification across financial services (25.91%), real estate trusts (12.66%), energy infrastructure (7.49%), and defensive utilities (15.76%).The Verdict: GBDV is tailored for investors who require a substantial current income stream, delivering a 3.84% dividend yield alongside a strong 12.90% 3-year annualized return.
However, its 10-year annualized return of 6.47% reinforces our core lesson... higher headline yields often come at the expense of mega-cap technology growth.Head-To-Head ETF Comparison Summary
To help you decide which fund aligns best with your portfolio goals, here is how these three LSE-listed UCITS funds stack up side-by-side:
| ETF Name & Ticker | Primary Focus | Dividend Yield | Ongoing Charge (TER) | 5-Yr Ann. Return (£) | Top Sector Weighting |
|---|---|---|---|---|---|
| Fidelity US Quality Income (FUSD) | US Quality & Growth | 1.38% | 0.25% | 11.95% | Technology (37.48%) |
| SPDR S&P US Dividend Aristocrats (USDV) | US Aristocrats (20+ Yrs) | 1.99% | 0.35% | 7.24% | Industrials / Defensive |
| SPDR S&P Global Dividend (GBDV) | Global Aristocrats (10+ Yrs) | 3.84% | 0.45% | 7.94% | Financials / Real Estate |
How Should You Build A Dividend ETF Portfolio In A Stocks And Shares ISA?
Selecting the best dividend ETF is only half the battle; where you hold your funds matters just as much.
In the UK, holding dividend assets inside an individual savings account, specifically a Stocks and Shares ISA, is the single most effective way to shelter your investments from HMRC taxes.With the UK tax-free dividend allowance recently slashed to just £500 per year, holding income funds in a taxable general dealing account can result in tax drag on your distributions.
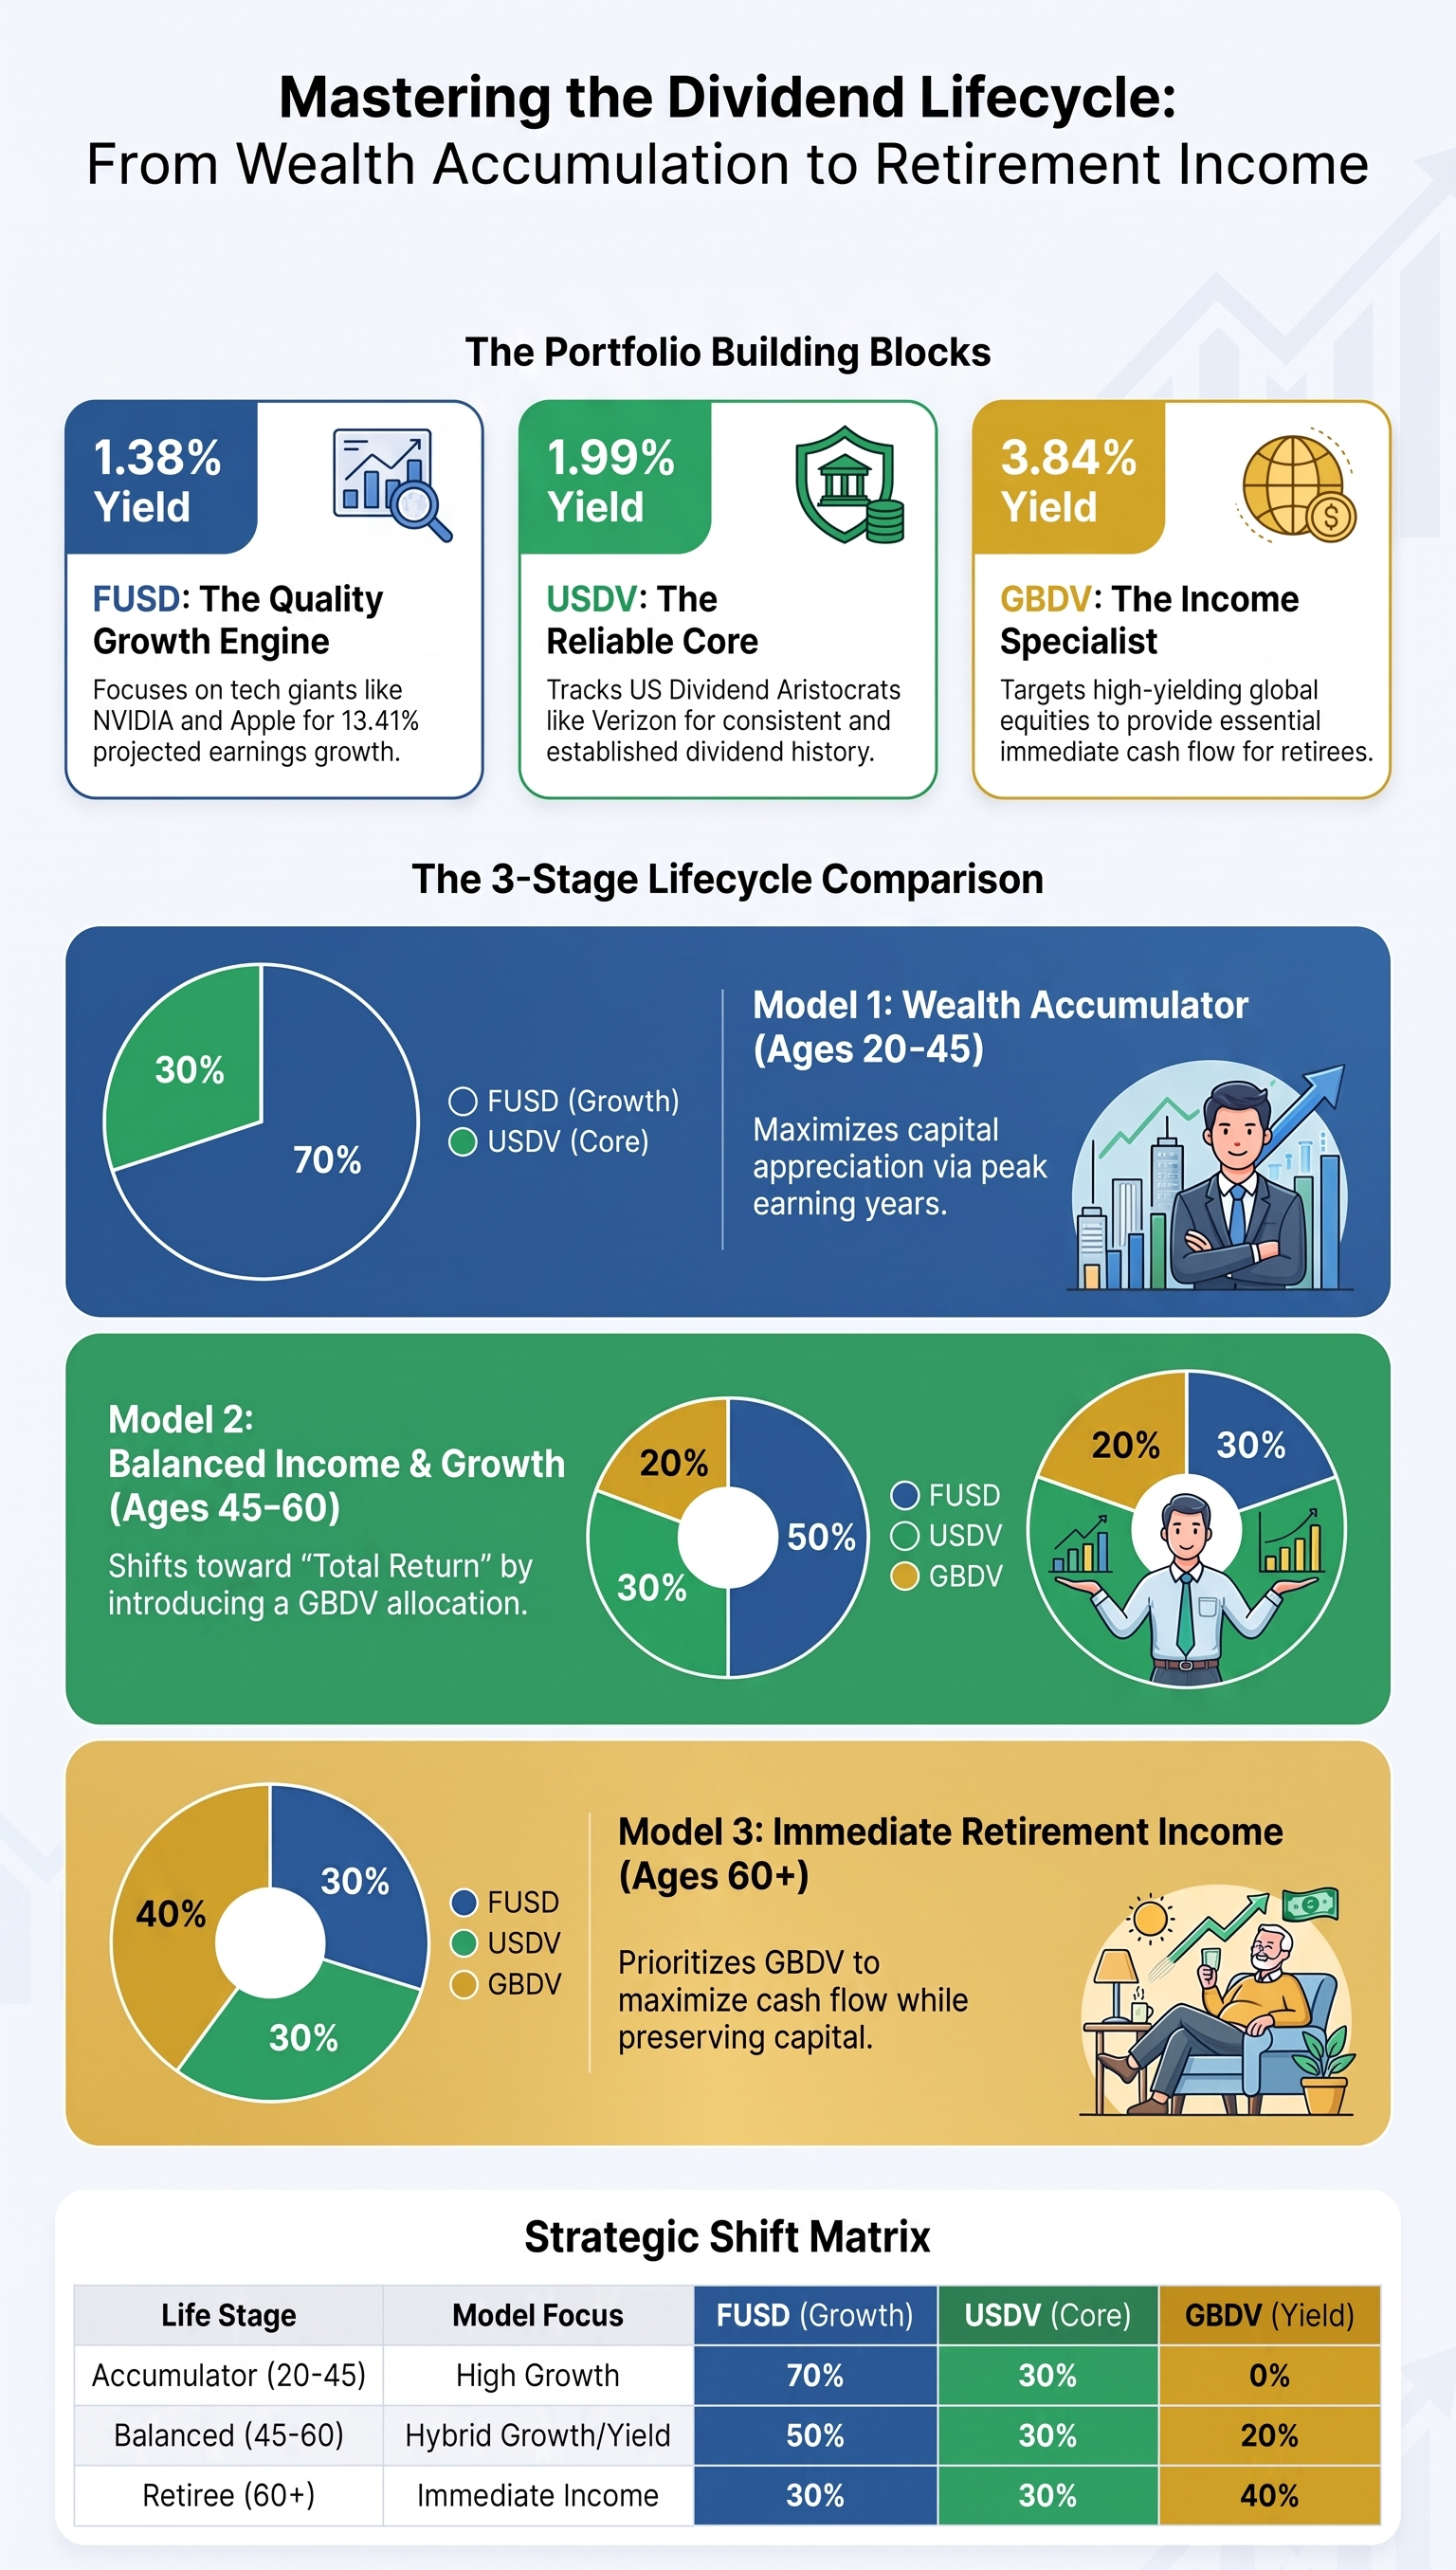
Inside a Stocks and Shares ISA, every single penny you receive in cash distributions and every pound of capital appreciation is 100% tax-free. You never have to report dividend payments on a self-assessment tax return or worry about Capital Gains Tax thresholds when rebalancing your holdings.Depending on your current life stage and financial goals, here are three sample portfolio allocation models using our deep-dive ETFs:
| Portfolio Model | Investor Age | Primary Goal | Asset Allocation |
|---|---|---|---|
| Model 1: The Long-Term Wealth Accumulator | Age 20-45 | Maximum capital appreciation with growing dividends over time. |
|
| Model 2: The Balanced Income & Growth Portfolio | Age 45-60 | A harmonious blend of capital growth, global diversification, and growing cash flow. |
|
| Model 3: The Immediate Retirement Income Portfolio | Age 60+ | Maximizing current dividend yield while maintaining defensive inflation protection. |
|
How Do You Reinvest Dividends To Supercharge Compound Interest?
Albert Einstein famously referred to compound interest as the eighth wonder of the world... "He who understands it, earns it; he who doesn't, pays it."
When you invest in the best dividend ETF during your wealth accumulation phase, automatically reinvesting your quarterly dividends creates a powerful compounding snowball.
Imagine rolling a small snowball down a long, snow-covered hill. As it rolls, it picks up extra snow, making its surface area larger. Because it is larger, it picks up even more snow on every single turn. By the time it reaches the bottom of the hill, it is a massive, unstoppable boulder.When you reinvest your cash distributions, you buy extra shares of the fund without depositing new money from your bank account.
On the next payment date, those newly purchased shares generate their own cash dividends, which you then use to buy even more shares. Over a 15 to 20-year horizon, reinvested dividends can account for well over 50% of your total return.Most major trading platforms offer automated Dividend Reinvestment Plans (DRIPs), allowing you to reinvest cash payouts automatically with little to no trading commissions.
What Common Blunders Should You Avoid When Buying The Best Dividend ETF?
To ensure your journey toward financial freedom remains on track, avoid these four common dividend investing traps.
- Chasing High Yields in Isolation: Never buy an ETF simply because it offers a headline yield of 8% or 10%. Always check its 5-year total return chart to verify that its share price is not declining.
- Ignoring the Total Expense Ratio (TER): Fund management fees quietly eat into your compound interest over time. Sticking to low-cost UCITS ETFs with TERs between 0.25% and 0.45% ensures more of your money stays invested working for you.
- Over-Concentrating in Your Home Market: Many UK investors fall prey to "home bias," putting all their capital into FTSE 100 UK dividend funds. While UK companies offer attractive yields, adding US and global dividend growth ETFs gives you access to fast-growing international sectors like technology, financials, and global communications.
- Not Using Tax-Efficient Wrappers: Holding dividend funds in a taxable dealing account subjects your distributions and capital gains to avoidable tax drag. Always maximize your £20,000 annual Stocks and Shares ISA allowance first.
Frequently Asked Questions About The Best Dividend ETF
What is the best dividend ETF for long-term investors?
The best dividend ETF for long-term investors is one that balances quality earnings growth, dividend increases, and strong total return rather than focusing solely on headline yield. High-quality UCITS funds like Fidelity US Quality Income (FUSD) and SPDR S&P US Dividend Aristocrats (USDV) are top choices for UK and European investors.
Why is total return better than dividend yield?
Total return measures the actual wealth generated by combining share price capital appreciation and reinvested dividends. A high dividend yield is meaningless if the underlying share price falls by a larger amount, causing permanent capital erosion.
What is a dividend yield trap?
A dividend yield trap occurs when a fund or stock displays an artificially high dividend yield because its share price has fallen dramatically due to declining business or declining earnings.
What is the difference between FUSD, USDV, and GBDV?
FUSD focuses on quality-screened US companies with high ROE and technology growth. USDV tracks US Dividend Aristocrats with 20+ consecutive years of rising payouts. GBDV tracks global Dividend Aristocrats with 10+ consecutive years of stable or rising distributions, offering a higher starting yield.
Are dividend ETF distributions tax-free in the UK?
Yes. When held inside a UK Stocks and Shares ISA or SIPP, all dividend distributions and capital gains are 100% exempt from tax.
Should I choose accumulating (Acc) or distributing (Dist) dividend ETFs?
Accumulating ETFs automatically reinvest dividends inside the fund to accelerate compound interest, making them best for wealth building. Distributing ETFs pay cash into your account, ideal for retirees seeking regular income.
How often do dividend ETFs pay distributions?
Most major UCITS dividend ETFs, such as FUSD, USDV, and GBDV, pay cash distributions to shareholders on a quarterly basis.
Can dividend ETFs lose money?
Yes. Dividend ETFs hold equities, so their share price will fluctuate with broader Stock Market movements. However, holding dozens of quality companies reduces the risk of severe loss compared to individual shares.
What is a good ongoing charge (TER) for a dividend ETF?
Competitive ongoing charges (TER) for physical equity dividend ETFs generally fall between 0.20% and 0.45% annually.
How do I reinvest my ETF dividends automatically?
Most online investment platforms offer an automated Dividend Reinvestment Plan (DRIP) feature that automatically buys additional shares whenever a dividend distribution is paid.
| 💡 Key Takeaways |
|---|
| Total Return Over Yield. Prioritise total return over headline dividend yield to avoid yield traps and capital erosion. |
| Quality Screens Matter. Choose funds with quality screens like Return on Equity to capture capital growth alongside dividends. |
| Fidelity US Quality Income (FUSD). Delivers outstanding total return with high-quality US tech and financial holdings. |
| SPDR US Dividend Aristocrats (USDV). Offers reliable defensive income backed by companies with 20+ years of consecutive dividend hikes. |
| SPDR Global Dividend (GBDV). Provides attractive global diversification and higher current distribution yields across international markets. |
| Tax Efficiency in ISAs. Hold your dividend ETFs inside a Stocks and Shares ISA to protect distributions from income tax. |
| Power of Reinvestment. Reinvest cash distributions to unlock exponential compound interest growth over the long term. |
| Avoid Home Bias. Diversify beyond UK dividend stocks into US and global dividend growth ETFs for superior sector exposure. |
| Watch Expense Ratios. Keep total expense ratios below 0.45% to keep more of your investment returns. |
| Diversification Protects Capital. Spreading capital across broad Exchange Traded Funds eliminates single-stock dividend risk. |